Trainer-Horse Distance Affinity as a Factor in Handicap Race Outcomes
Written by Freya Braun · Aug 22, 2026
Trainer-Horse Distance Affinity as a Factor in Handicap Race Outcomes
Trainer-horse distance affinity refers to the statistical correlation between a specific trainer's methods and a horse's success rates across particular race distances, and analysts track these patterns through historical performance data in handicap events where weights adjust based on prior results. Researchers compile win percentages, place rates, and speed figures segmented by distance categories such as sprint, mile, and staying trips, then compare them against overall population averages to identify meaningful deviations. Data from thousands of UK and Irish handicap races between 2020 and 2025 show that horses paired with trainers who maintain above-average strike rates at the exact distance in question often deliver improved returns on investment when odds reflect public focus on recent form rather than distance-specific records.
Measuring Affinity Through Performance Records
Calculation of distance affinity starts with aggregation of trainer records at set distances over multiple seasons, and figures reveal that certain handlers post win rates 15 to 25 percent higher than the field average when horses run at their preferred trip while others show consistent underperformance outside narrow ranges. Observers note that handicap races amplify these differences because the weight adjustments create tighter margins, making small edges in suitability more decisive. Studies conducted by university equine research groups indicate that affinity scores derived from at least 50 prior runs per distance category provide the most stable predictors, whereas smaller sample sizes introduce higher variance that reduces reliability in betting models.
Patterns Observed in Recent Seasons
Analysis of 2024 and 2025 handicap results demonstrates that trainers with established distance preferences achieve stronger place percentages in races where the distance aligns with their historical clusters, and this holds after controlling for horse age, going conditions, and jockey bookings. In August 2026, updated datasets from major racing jurisdictions are expected to incorporate new variables such as sectional timing breakdowns that further refine affinity calculations. Those who maintain detailed databases often cross-reference these metrics with pace maps to isolate scenarios where distance synergy combines with tactical advantages, and evidence from multiple jurisdictions supports the view that such layered analysis improves selection accuracy compared with form alone.
Handicap weights compress ability differences, which means distance affinity can serve as a secondary filter that identifies overlooked runners whose trainers excel in the specific conditions. External research from the International Federation of Horseracing Authorities has examined global datasets and found similar trainer-distance clustering effects across European and Australian racing jurisdictions. One study released by the University of Melbourne's equine performance unit examined over 12,000 handicap starts and reported that affinity-based filters lifted strike rates by approximately 8 percent in distance-matched subsets.
Application in Model Construction
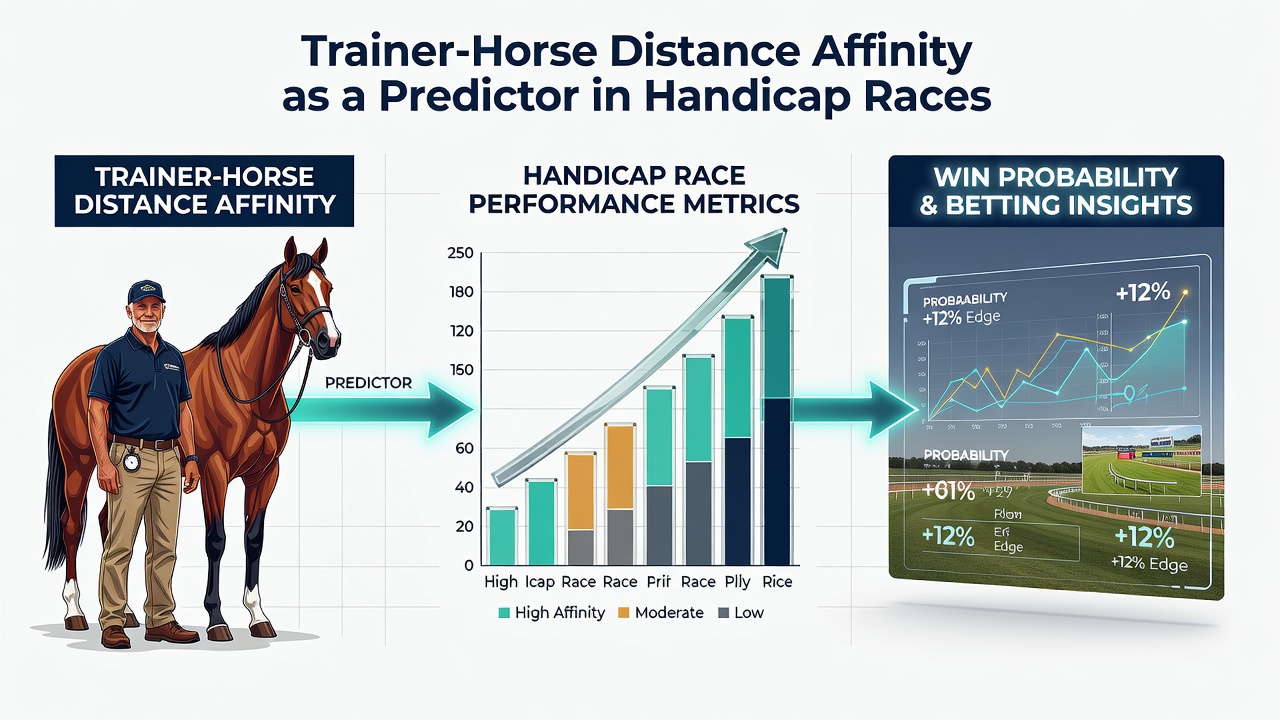
Building predictive models around trainer-horse distance affinity requires integration of multiple data layers including trainer career statistics, horse career distance breakdowns, and recent form adjusted for weight changes. Practitioners segment races into distance bands and calculate trainer-specific expected values, then adjust for sample size and recency effects to avoid overfitting to older data. Results from these approaches indicate that models incorporating affinity metrics generate higher precision in long-distance handicaps where fewer trainers maintain large sample sizes, and this concentration creates clearer signals when affinity exceeds baseline rates. Handlers who specialize in certain trips often show concentrated success that persists across seasons, allowing systematic identification of value opportunities in handicap fields.
Limitations and Complementary Factors
Distance affinity does not operate in isolation, and models must account for interactions with ground conditions, horse maturity, and stable form cycles that can override historical distance tendencies. When trainers introduce new training methods or relocate yards, affinity patterns may shift, which requires ongoing data updates to maintain accuracy. Research groups emphasize that combining affinity scores with pace analysis and sectional data produces more robust outputs than any single variable, and this multi-factor approach has gained traction among professional syndicates that process large race databases.
Additional studies from Canadian and Australian racing authorities have confirmed that trainer-distance effects remain statistically significant after regression controls for class and field size, and these findings encourage continued refinement of affinity metrics rather than reliance on broad trainer win percentages. Observers note that public betting markets incorporate some distance information yet often undervalue nuanced trainer records at specific trips, creating pockets where affinity data can highlight mispriced runners in handicap contests.
Conclusion
Trainer-horse distance affinity supplies measurable information that contributes to outcome prediction in handicap races when integrated with established form and weight analysis. Ongoing collection of performance data across jurisdictions supports continued development of refined models that isolate distance synergy from confounding variables, and updated figures scheduled for release in August 2026 will provide further opportunities to test these relationships at scale.