Momentum Mapping in Live Tennis Markets Guides Adaptive Stake Adjustments
Written by Jakob Bennett · Jun 25, 2026
Momentum Mapping in Live Tennis Markets Guides Adaptive Stake Adjustments
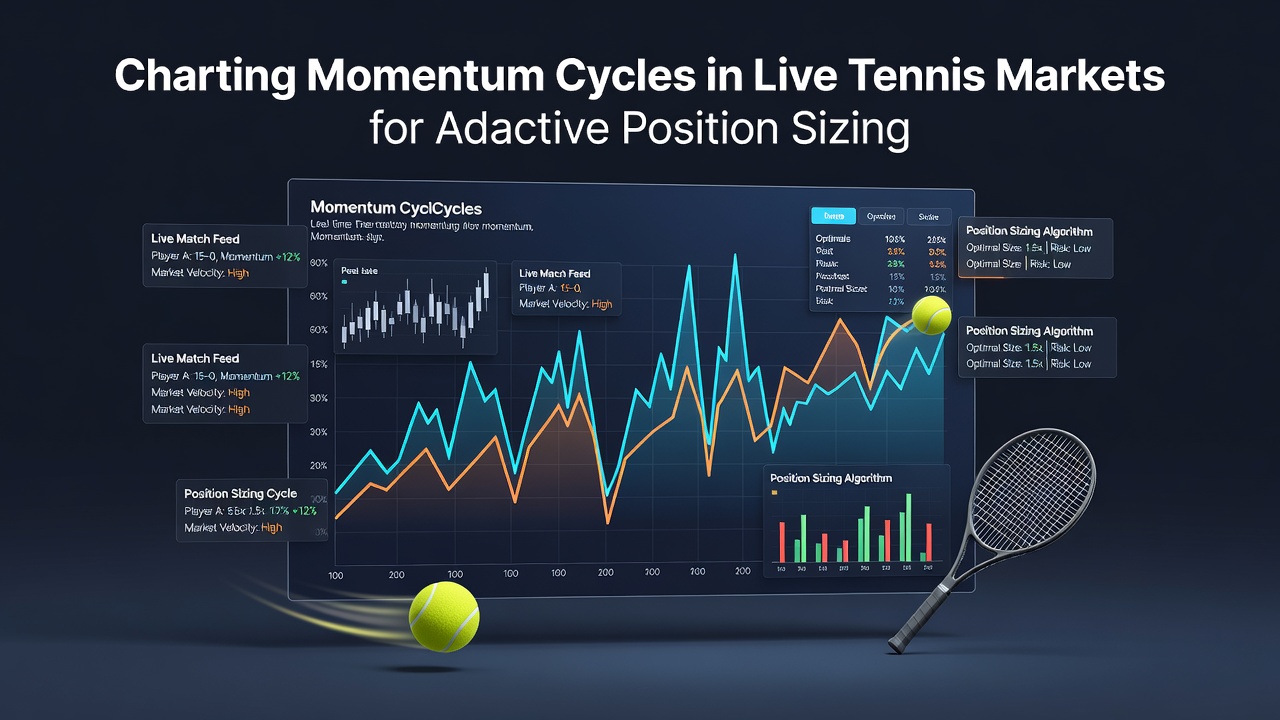
Live tennis markets move in distinct cycles driven by serve breaks, set transitions, and player recovery patterns, and those who track these shifts apply data layers to resize positions accordingly. Observers note that momentum often builds after a player holds serve under pressure or converts a break point, which then influences in-play odds across multiple exchanges. Data from major tournaments shows these cycles typically last between three and seven games before reversing, creating windows where adjusted stakes can align with probability swings.
Identifying Core Momentum Indicators
Analysts break momentum into measurable components such as first-serve percentage trends, unforced error clusters, and rally length averages, all updated after every point in professional matches. These metrics feed into models that flag when a player gains or loses control, allowing position sizes to expand during confirmed upswings and contract during uncertain stretches. Research from sports analytics groups indicates that serve-hold streaks longer than four games correlate with a measurable tightening of live odds, yet the reverse holds true when double-fault rates spike suddenly.
Tracking Real-Time Data Streams
Platforms that stream point-by-point statistics enable continuous recalculation of expected value, and traders integrate these feeds with historical player profiles to detect when a cycle is accelerating. For instance, a competitor who has won six of the last eight service games often sees implied probabilities shift upward until an opponent forces a tiebreak or captures an early break. Those monitoring multiple matches simultaneously use threshold alerts to highlight when momentum metrics cross predefined levels, prompting immediate stake recalibration without manual chart review.
Adaptive Position Sizing Frameworks
Position sizing in this environment relies on scaling exposure proportionally to the strength and duration of detected cycles rather than fixed percentages of bankroll. Models assign multipliers that increase when multiple indicators align, such as improved winner-to-error ratios combined with favorable court-surface adjustments, while reducing exposure if volatility metrics rise without clear directional bias. Figures from European betting data providers reveal that adaptive approaches maintain steadier equity curves across Grand Slam events compared with static staking, particularly during extended fifth-set encounters where fatigue patterns emerge late.
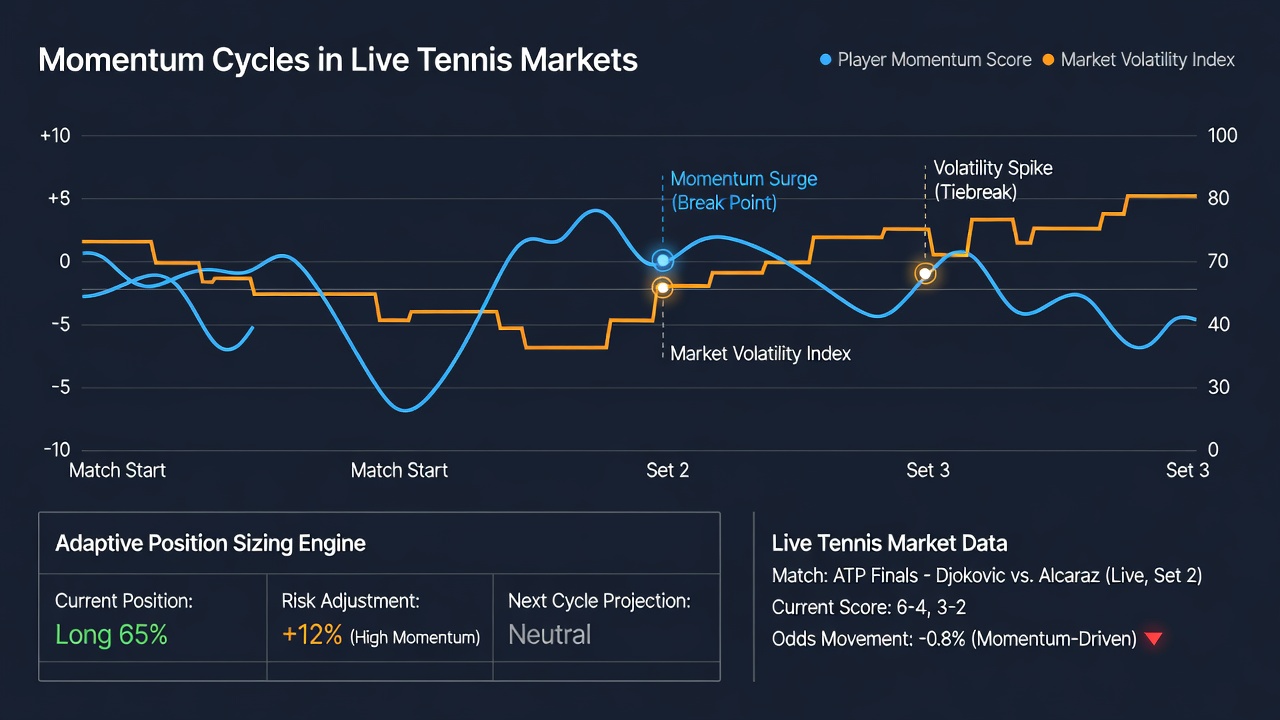
One documented approach divides cycles into four phases: acceleration, peak, deceleration, and reset, each tied to specific stake bands. During acceleration phases after a break of serve, exposure may rise by 25 to 40 percent above baseline levels, whereas reset phases following a set change trigger a return to neutral sizing until fresh data confirms direction. Australian wagering reports from 2025 noted similar patterns in ATP and WTA events, where surface-specific adjustments further refined these bands for clay versus hard-court tournaments.
Integrating External Variables
Weather conditions, court speed changes, and medical timeouts introduce additional layers that can interrupt or extend momentum cycles, requiring models to incorporate real-time environmental inputs alongside player statistics. Observers have recorded instances where high humidity correlates with longer rallies and elevated error rates, shifting the expected length of a cycle by several games. Position sizing algorithms therefore apply dampeners when such variables exceed historical norms, preventing oversized commitments during periods of elevated uncertainty.
By June 2026, several data vendors had expanded coverage to include micro-metrics such as average serve speeds per game and net approach success rates, allowing finer cycle detection in lower-tier Challenger events as well. These enhancements support traders who operate across both main-tour and secondary circuits, where market liquidity varies and momentum signals can persist longer due to fewer statistical resets.
Practical Application Examples
Consider a scenario in which a player converts a break at 4-4 in the second set and immediately holds; charting tools register simultaneous gains in first-serve points won and rally dominance, triggering an upward stake adjustment for the next two service games. If the opponent responds with consecutive holds and reduces unforced errors, the model flags deceleration and scales exposure back before the set concludes. Such sequences appear frequently in best-of-three formats, where shorter overall duration compresses cycle windows and demands quicker recalibration.
Another case involves matches extending into deciding sets, where fatigue indicators become prominent after the tenth game. Historical datasets compiled by independent research firms show that players with superior endurance profiles often sustain momentum longer in these phases, supporting graduated stake increases until a medical timeout or visible physical decline interrupts the pattern.
Conclusion
Charting momentum cycles supplies a structured method for resizing positions in live tennis markets by linking observable performance shifts to probability updates. Continuous refinement of indicator thresholds and integration of environmental factors keeps these frameworks responsive across varying match conditions and tournament levels. Data sources such as those maintained by the American Gaming Association and academic reviews from institutions including the University of Sydney continue to supply comparative benchmarks that inform ongoing model development.