How Atmospheric Pressure Data Enhances Endurance Sport Betting Models
Written by Jakob Bennett · Jul 9, 2026
How Atmospheric Pressure Data Enhances Endurance Sport Betting Models
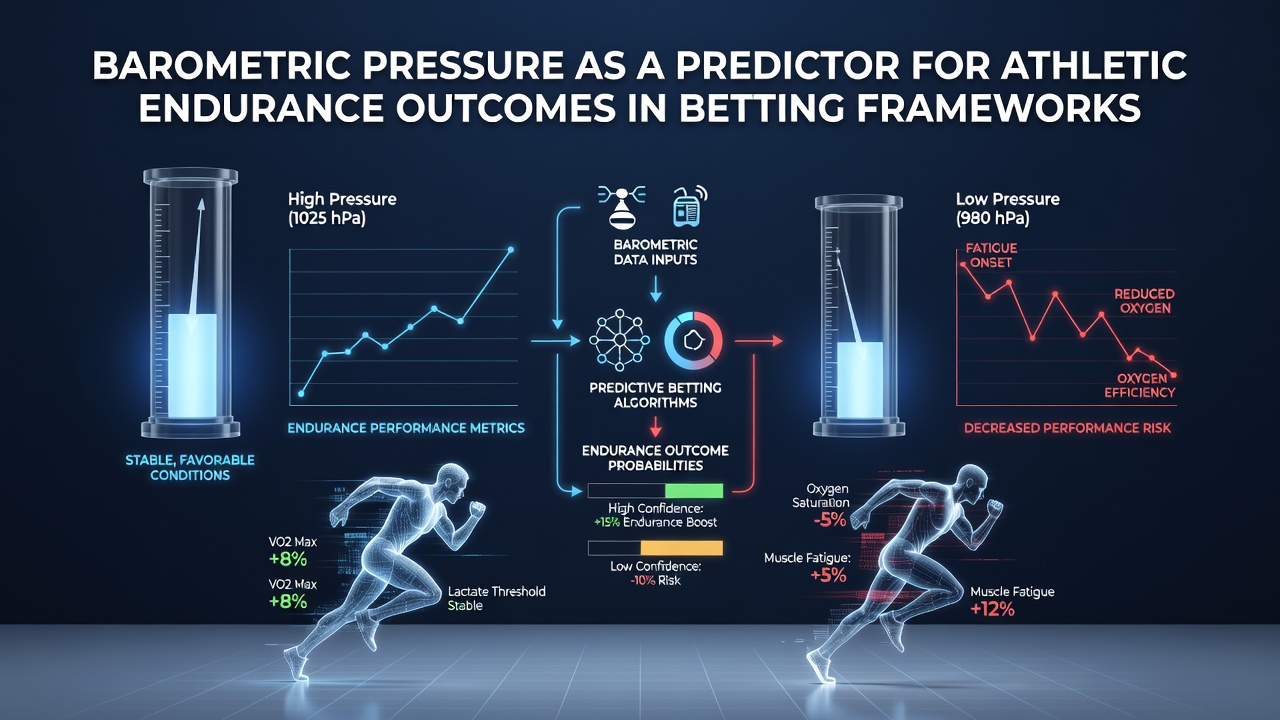
Barometric pressure readings serve as measurable inputs within predictive models that evaluate endurance outcomes across sports such as marathon running, cycling, and triathlon events, where air density directly influences oxygen availability and aerobic efficiency. Researchers have documented consistent correlations between pressure fluctuations and physiological responses, particularly when athletes compete at varying elevations or under shifting weather systems. Meteorological agencies collect real-time barometric data through standardized networks, and analysts integrate these figures into statistical frameworks that adjust probability estimates for race results. Lower pressure values often coincide wth reduced oxygen partial pressure, which increases cardiovascular strain during prolonged efforts and can extend finishing times by measurable margins. Higher pressure tends to stabilize air density, supporting more predictable performance baselines in sea-level competitions.Physiological Mechanisms Behind Pressure Variations
Endurance athletes experience measurable changes in oxygen uptake when barometric pressure drops, as thinner air reduces the driving force for gas exchange in the lungs. Studies conducted by exercise physiologists at institutions including the University of Colorado have quantified these effects through controlled altitude simulations, showing that a 10 percent pressure decrease can elevate heart rate by 5 to 8 beats per minute during submaximal exercise.
Coaches and data teams monitor pressure trends in the days leading up to events because rapid drops frequently precede weather fronts that also introduce heat or humidity variables. These combined factors compound fatigue accumulation, which betting models then translate into adjusted odds for individual competitors or team totals.
Integration into Quantitative Betting Frameworks
Modern betting platforms incorporate barometric forecasts alongside historical performance datasets to refine outcome probabilities. Algorithms process pressure readings from multiple weather stations near competition venues, then apply regression coefficients derived from past races where similar conditions occurred. This approach allows models to generate dynamic lines that shift as forecasts update in the hours before start times.
Analysts at organizations such as the Australian Institute of Sport have published reports detailing how pressure-adjusted metrics improve prediction accuracy for events held above 1,500 meters. Their findings indicate that incorporating barometric data reduces mean absolute error in time predictions by approximately 12 percent compared with models that rely solely on past results and training logs.
Recent Applications in 2026 Events
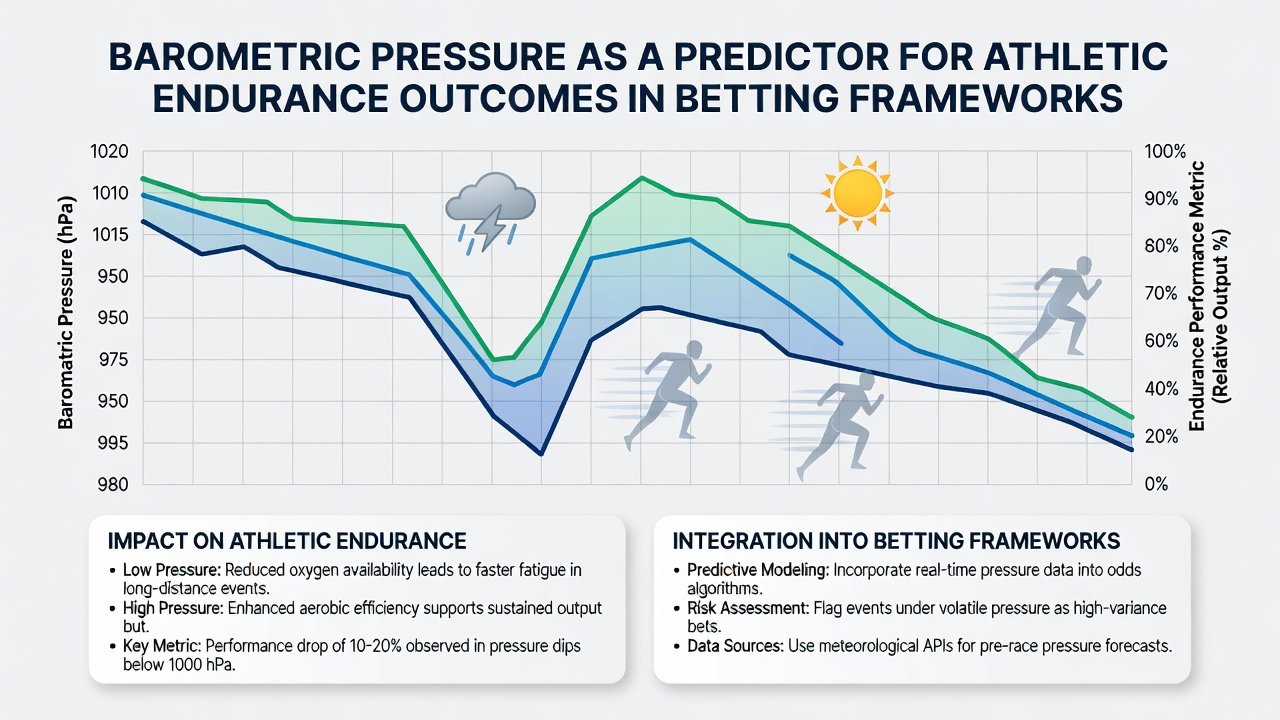
During July 2026, several high-profile endurance races took place under documented pressure swings that influenced both athlete strategies and market movements. Organizers of the European Mountain Running Championships reported pressure readings 25 hectopascals below seasonal averages on race day, prompting teams to adjust pacing plans and hydration protocols accordingly. Betting operators updated their frameworks in real time, shifting implied probabilities for top finishers based on these atmospheric inputs.
Similar adjustments appeared in North American trail events where pressure gradients created headwinds on exposed sections of courses. Data providers supplied hourly pressure grids that quantitative teams layered into existing machine-learning pipelines, generating revised expected values for prop bets on finishing times and placement ranges.
Limitations and Model Refinement
Barometric pressure alone does not determine outcomes because individual physiological adaptations, course profiles, and tactical decisions also contribute substantial variance. Analysts therefore combine pressure data with additional variables such as temperature, humidity, and wind vectors to avoid over-reliance on any single factor. Validation studies continue to test whether pressure thresholds produce statistically significant edges across different athlete cohorts and event distances.
Regulatory bodies in multiple jurisdictions, including Sport Integrity Australia, require operators to maintain transparent records of data sources used in automated betting systems. This oversight ensures that atmospheric inputs remain part of documented methodologies rather than proprietary black boxes.
Future Developments in Pressure-Based Analytics
Advances in portable sensor technology now allow teams to record micro-scale pressure variations along actual race routes rather than relying solely on fixed weather stations. These granular datasets feed into more precise simulation environments that betting frameworks adopt to stress-test endurance projections under hypothetical pressure scenarios. Academic collaborations with meteorological services continue to expand the resolution of forecast models, particularly for events scheduled weeks in advance.
Conclusion
Barometric pressure functions as one measurable component within broader analytical systems that connect atmospheric conditions to endurance performance metrics. When integrated with established physiological research and historical race data, these readings support refined probability estimates that betting frameworks apply across multiple sports and competition levels. Continued validation through independent studies and regulatory review shapes how such environmental inputs evolve within quantitative prediction environments.