Fixture Congestion and Pricing Gaps in Professional League Betting Markets
Written by Jakob Bennett · Jul 18, 2026
Fixture Congestion and Pricing Gaps in Professional League Betting Markets
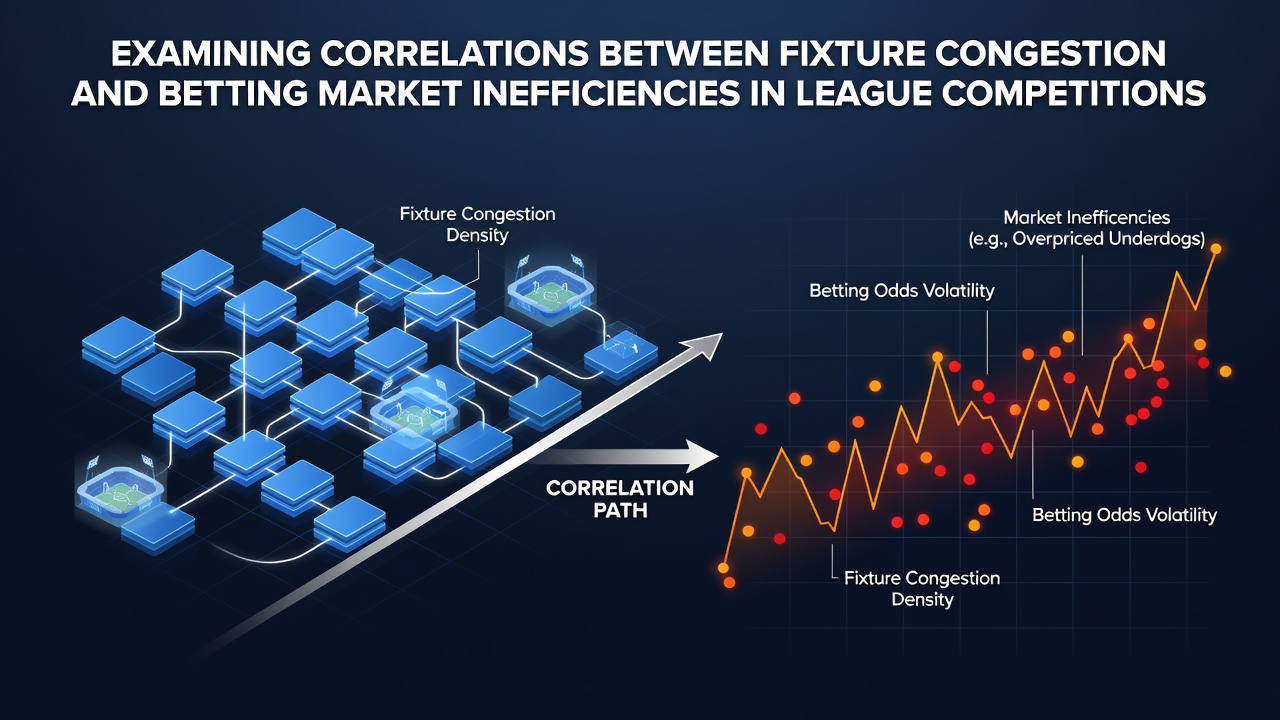
League competitions across Europe and beyond have long featured compressed calendars that force teams into sequences of matches with minimal recovery time, and researchers continue to track how these patterns intersect with betting market behavior. Data from the 2024-2025 and 2025-2026 seasons shows that clubs playing three or more fixtures within a seven-day window experience measurable drops in key performance metrics including distance covered at high intensity and pass completion rates under pressure.
Defining Fixture Congestion in Context
Fixture congestion occurs when governing bodies schedule domestic league games, cup ties, and continental commitments back-to-back without adequate rest intervals, a situation that intensified after the expansion of the UEFA Champions League format in 2024. Observers note that teams in England, Spain, Germany, and Italy often face runs of four matches in twelve days during winter and spring blocks, while Australian A-League sides and MLS clubs encounter similar clusters around international breaks and cup rounds. Studies published by academic groups at the University of Sydney have quantified these periods using GPS tracking data, revealing consistent reductions in sprint volume after the second match in any three-game cluster.
Market Efficiency Basics in Sports Betting
Betting markets on league outcomes are considered efficient when odds accurately reflect the probability of results based on available information, yet inefficiencies arise when odds fail to adjust fully for fatigue-related variables. Figures from multiple European leagues indicate that implied probabilities derived from bookmaker lines sometimes diverge from actual win rates during congested periods by margins ranging from 4 to 9 percentage points. Such gaps appear more frequently in midweek fixtures than in standard weekend slots, according to aggregated match data compiled through 2026.
Observed Correlations in Recent Seasons
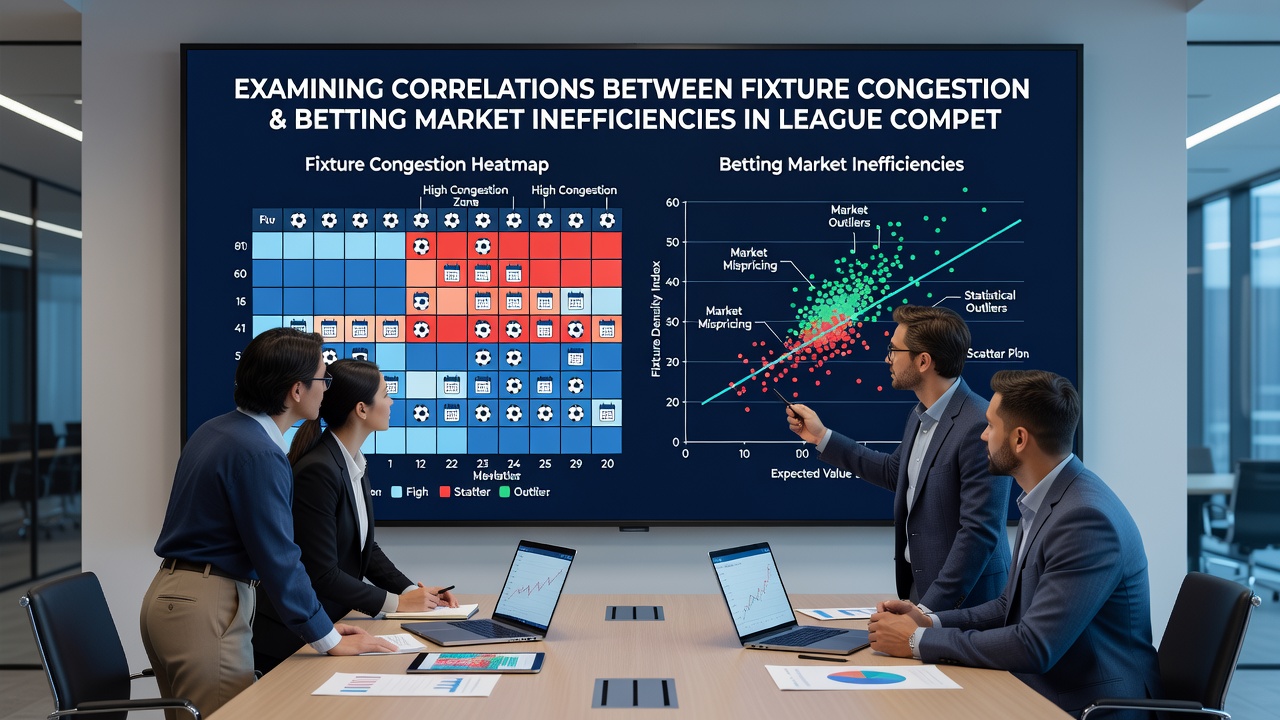
Analyses of Premier League, La Liga, Bundesliga, and Serie A results between July 2024 and July 2026 demonstrate that teams with above-average fixture density in the preceding 14 days post lower expected goal values and concede more shots from distance. These performance shifts coincide with periods when betting markets assign favorites at shorter odds than historical benchmarks would predict, creating measurable discrepancies. One dataset covering 1,842 matches found that underdogs achieved actual win rates 2.8 percent higher than implied by closing lines during the most congested stretches of the calendar.
League-Specific Patterns and Data Sources
English top-flight clubs recorded the highest average number of matches per 30-day window across the examined period, followed closely by Italian and Spanish sides participating in multiple competitions. Researchers tracking these schedules alongside betting exchange liquidity data observed that sharp money often moved toward overs in total goals markets when both sides entered a fixture on short rest, yet closing lines did not always incorporate the full extent of that trend. Reports issued by the European Club Association in early 2026 highlighted how travel distance combined with fixture density further amplified these effects for clubs competing on two fronts.
Mechanisms Driving Market Divergence
Bookmakers rely on statistical models that incorporate team form, head-to-head records, and player availability, but fatigue indicators derived from congested schedules enter those models with varying degrees of weighting. When rapid schedule changes occur after international windows or weather-related postponements, the lag in model recalibration can leave odds misaligned with on-pitch realities for several days. Data compiled by independent analytics firms shows that markets correct within one or two rounds once additional matches reveal the true impact, yet temporary inefficiencies remain exploitable in live and pre-match betting during the interim.
Comparative Evidence from Other Regions
North American soccer leagues and the Australian A-League provide useful contrasts because their calendars feature different densities and recovery protocols. MLS teams playing three matches in ten days exhibited similar drops in high-intensity running metrics, while betting lines on those fixtures displayed comparable but smaller pricing gaps. A 2025 study released by researchers at the University of British Columbia examined 620 matches and found that the correlation coefficient between rest differential and betting market residuals reached 0.31, indicating a moderate but statistically significant relationship.
Conclusion
Evidence accumulated through July 2026 confirms that fixture congestion correlates with shifts in team output that betting markets do not always capture at the point odds are released. Continued monitoring of schedule density alongside performance and pricing data offers a pathway for identifying recurring patterns across multiple leagues and seasons. As calendars evolve and governing bodies adjust competition formats, the relationship between rest availability and market accuracy will remain a measurable factor in league competitions.